GeoMoose User Quickstart
Getting Started
Geomoose is a GIS data portal management framework. The basic capabilities of GeoMoose are contained in the on-line demo http://www.geomoose.org/demo/geomoose.html which may be downloaded as part of the standard installation (http://www.geomoose.org/demo/geomoose.html).
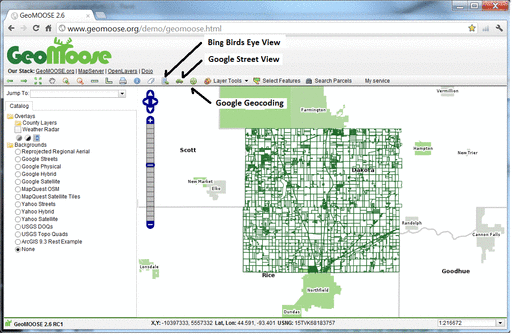
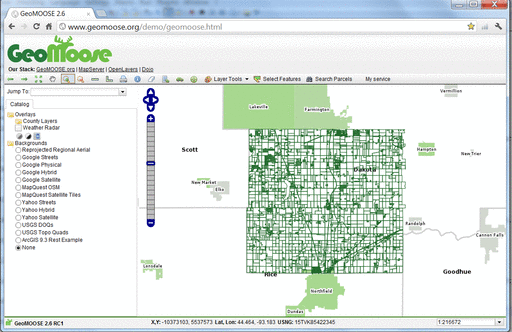
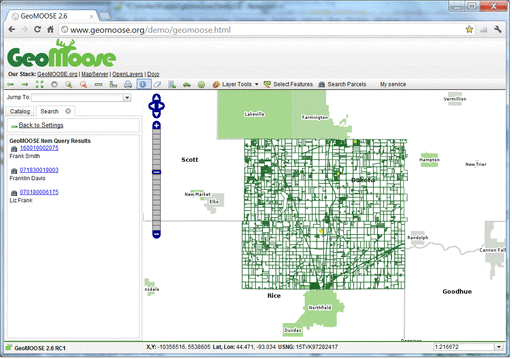
When you start GeoMoose the mapping environment will appear.
The Interfaces presented above shows:
- A banner bar
- A tool bar
- A map window with
- A navigation and zoom controls
- A side menu with:
- A “Jump to” location pull down list
- Control tabs starting with “Catalog”, for displaying the layer list. As needed, additional tabs will appear: an “Information” readout, a “Custom” output tab, and others.
- A Footer bar with:
- Multiple coordinate readouts, one each for: X,Y (local dataset coordinates), LAT/LON (Decimal) and United States National Grid (USNG)
- A editable pull down list for a view scales to choose from or define.
IDing a location in GeoMoose
You can ID a location in the interface by clicking on the “identify”, (“i” in a blue circle icon) button in the top toolbar, and then clicking a point on the map to identify.
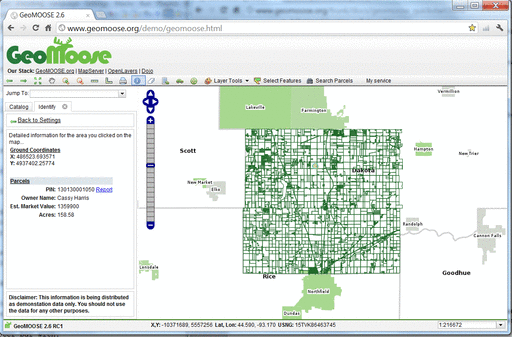
The menu along the left side of the Map view will display a report related to the point that you clicked in the map. This is a service in the GeoMoose Demo package that has been configured to respond to quereies for the “Parcel” layer when a point is clicked.
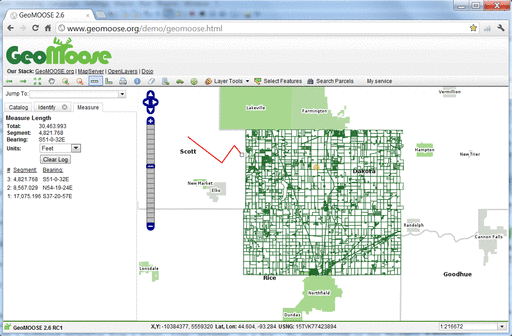
Measuring in GeoMoose
GeoMoose has two measuring tools installed and activated by default. Clicking the straight ruler icon in the top toolbar, will start the linear measuring tool. You can click as many points as you like in the map window and a trailing polyline will be drawn. When you get to your last point, just double click to stop. The total distance of all lines drawn will be used to generate the “Total Length” in the units of your choice in the side menu. Clicking the other ruler icon in the top toolbar, will allow you measure areas.
These user tools are considered services by the GeoMoose interface and can be added to via GeoMoose’s MAPBOOK control file.
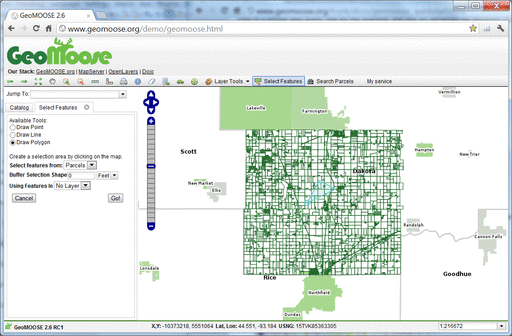
Selecting Features
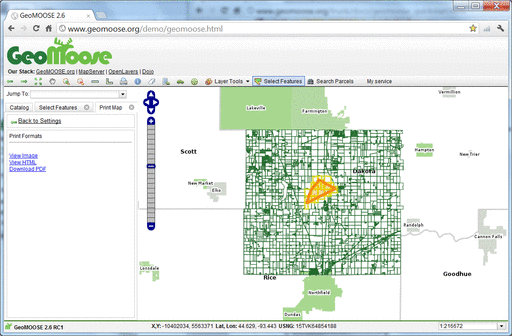
You can select features from a Point, Line, polygon, or a Box. To start, click on the “Select Features” icon (polygon with pencil), and start drawing a selection polygon in the map. You can double click the last point to finish the drawing process. This screenshot shows the drawing process on the map. the left menu is displaying the input form for the criteria of the selection, in this case a Polygon against the “Parcels” layers. You also have the option to select features based on a buffer which is a “0” value by default. This is a service in the GeoMoose Demo package that has been configured to respond to quereies for the “Parcel” layer.
The above screenshot is showing the “PARCEL” layer for selects and also using the “Parcels” layer as the attributes to report back on. Two different layers can be used in a double pass query, one for the selection, and one for retrieving the attributes from for reporting. The sceenshot below takes the selection process further by adding in a buffering distance of 100ft.
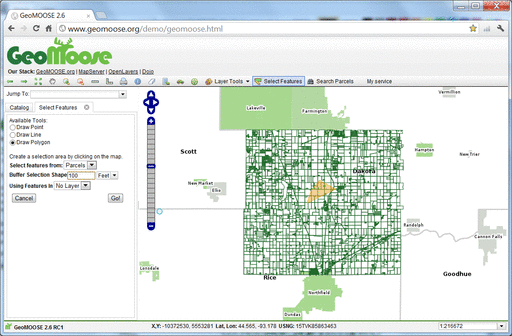
Clicking the “Go!” button in the side menu in the above screenshot will generate a report and display it in the side menu. NOTE: The output can also be configured to be sent to a new window as well.
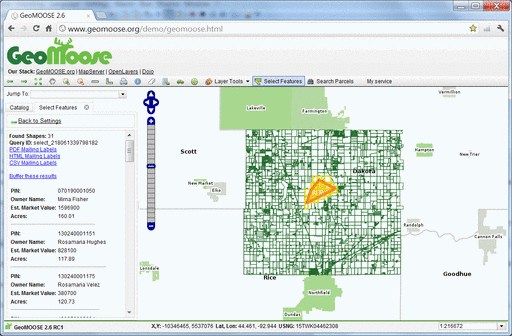
The results above demonstrate the service response to the buffered query by displaying the result in the map via a selection overlay that highlights the original selection area polygon (purple), the crossing and within parcels at a 100ft buffer (orange) and the parcels crossing and within the buffered polygon (yellow). The side menu now displays the reported results of the query process with options for outputting in other formats for mailing labels.
Searching
You can also search for features by attribute. To start click on the “Search Parcels” icon and enter your search parameters on the search menu then pressing the “Go!” button. The following screenshot demostrates a search of all parcel owners containing the name “frank”.
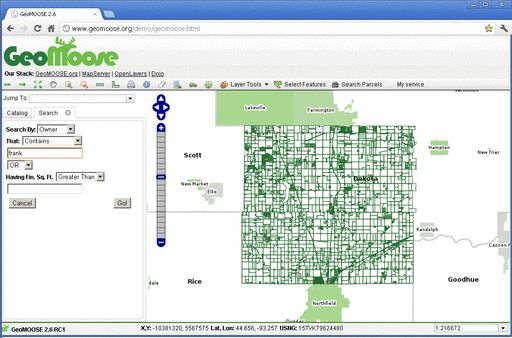
Three results appear in the list and are highlighted on the map.
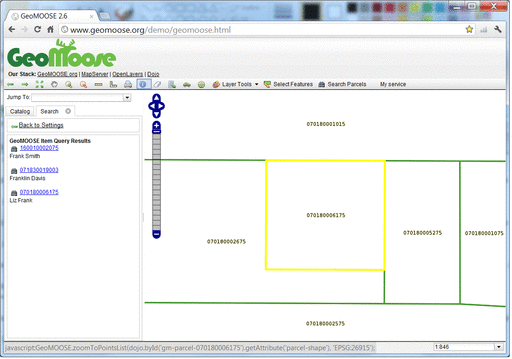
Clicking the binocular icon/parcel number in blue will zoom you to the specific parcel as illustrated in the following screenshot.
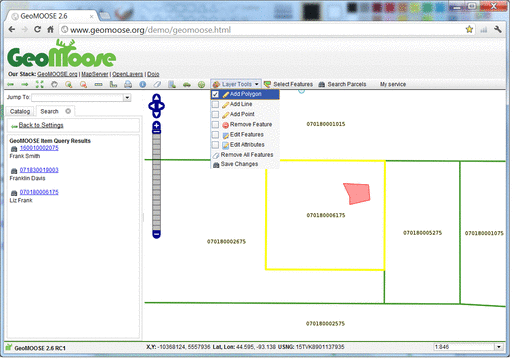
Layer Tools
GeoMoose lets you edit layers graphically. Setting up a layer for editing is discussed elsewhere on the GeoMoose website. The demo is setup for you to edit a sketch layer as illustrated in the following screenshot.
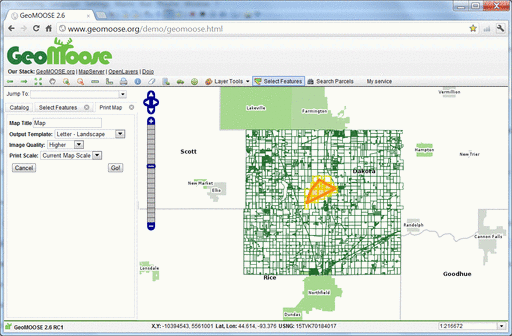
Printing
This next screenshot shows what the Print Map service looks as provided with demo for GeoMoose. The side menu in the following view, shows the options available for printing the current mapview. Sheet size, orientation, resolution for both raster image backgrounds and for overall output are also available.
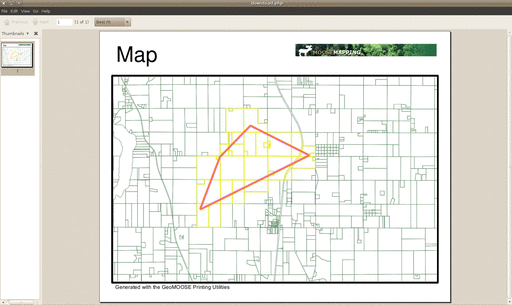
The next menu displays the choices available for output, by default GeoMoose allows a composite Raster Image, a HTML file, or a PDF. Clicking on a PDF output option will present you with a dialog similar to:
The following screenshot shows an example of a PDF output in landscape mode.
Other Services
GeoMoose can also link to other on-line services such as birds eye view from BING, StreetView from Google and Geocoding from Google. Always remember to review license requirements for any external services to ensure compliance.