Vector Editing Introduction
Animation of Vector Editing
The Vector Editing capabilities of GeoMoose allow your users to create, edit, and delete geometry and properties of point, line, and polygon vector features and save those edits on your server. To enable the editing of features, you must:
Setup a WFS-T 1.1.0 compliant server such as GeoServer or TinyOWS
Configure a map-source in your GeoMoose mapbook to enable the editing of the layer
This is a basic walk-through to show how to configure GeoMOOSE to allow editing of features. It will cover two possible WFS-T server configurations:
You will need only one of the two above configurations to experiment with editing vectors with GeoMoose. Other configurations are possible, such as GeoServer + PostGIS, but are not described here.
Vector Editing Tutorial
Installing the Demo Data
GeoServer can use various databases to store data. The easiest to configure for the purpose of this demo is GeoPackage, a file-based relational database built on SQLite.
Download the latest release (v3.7 or greater) of the GeoMoose Demo data from gm3-demo-data.
Unzip the data in a folder of your choice.
WFS-T Server: GeoServer + GeoPackage
These instructions are for GeoServer 2.17.2, but later versions will work and the setup should be similar.
The best documentation on installing and using GeoServer comes from
GeoServer itself. Install GeoServer as per the instructions in the
GeoServer documentation, and startup a GeoServer instance
by executing Geoserver\bin\startup.sh. If you’ve installed GeoServer on Windows, start GeoServer by executing
C:\Program Files\GeoServer\bin\startup.bat, and make sure you run startup.bat with Administrator privileges.
Now open a browser and go to http://localhost:8080/geoserver/web/. Login to GeoServer by using the default credentials: username admin, password geoserver.
Configuring GeoServer to Use census.gpkg
Note the location of the
census.gpkgfile. It will be in thegm3-demo-data/demo/census/folder.
Add a New Workspace
In the left control-panel column of GeoServer, under the “Data” header, click on “Workspaces”.
Click the green “+” button.
Name the work space
Geomoosewith a Namespace URI ofhttp://geomoose.demo.
Add a New Data Store
In the left control-panel column of GeoServer, under the “Data” header, click on “Stores”.
Click the green “+” button to create a new data store.
On the New data source page, click on “GeoPackage”
Use the following settings:
Workspace: Geomoose
Data Source Name: census_data
Description: Census Data for Demo
Enabled: Should be checked to indicate “true”.
The rest of the settings are for PostgreSQL, please fill them out to match the information you used to load the shapefile.
Add New Layers - publish
Enable CORS (if necessary)
WFS-T Server: TinyOWS + PostGIS
Install Mapserver’s TinyOWS
Install PostGIS and Load the Places Shapefile
Install PostGreSQL. Install PostGIS. Create a user gis with a
password of super_gis, create a database named gis2 and grant
all privileges to user gisto the gis2 database.
Now load the Places shapefile. There are a couple of good applications
for doing this, GDAL’s ogr2ogr and PostGIS’shp2pgsql. Whichever tool you use, the layer should be
named census_cities for the purposes of this example.
A typical ogr2ogr string to load the data will look similar to this:
ogr2ogr -f PostgreSQL "PG:dbname=gis2 user=gis password=super_gis" tl_2019_27_place.shp tl_2019_27_place -nln census_cities -nlt GEOMETRY -lco DIM=2
The commands for the other two point and line shapefiles would be:
ogr2ogr -f PostgreSQL "PG:dbname=gis2 user=gis password=super_gis" tl_2019_27_pointlm.shp tl_2019_27_pointlm -nln census_landmarks -nlt GEOMETRY -lco DIM=2
ogr2ogr -f PostgreSQL "PG:dbname=gis2 user=gis password=super_gis" tl_2019_27_prisecroads.shp tl_2019_27_prisecroads -nln census_roads -nlt GEOMETRY -lco DIM=2
Configure TinyOWS by replacing the content of TinyOWS config.xml with:
<tinyows online_resource="http://localhost/cgi-bin/tinyows.exe"
         schema_dir="/ms4w/apps/tinyows/schema/"
         check_schema="0"
         check_valid_geom="0"
         log="/ms4w/tmp/tinyows.log"
         log_level="15">

<pg host="localhost" user="postgres" password="postgres" dbname="gis2" port="5432"/>

<metadata  name="TinyOWS Server"
          title="TinyOWS Server" />

<contact name="TinyOWS Server"
         site="http://www.tinyows.org/"
         email="tinyows-users@lists.maptools.org" />

<layer retrievable="1"
       writable="1"
       ns_prefix="Geomoose"
       srid="4326"
       ns_uri="http://localhost/cgi-bin/tinyows.exe"
       name="census_cities"
       title="census_cities"
       table="census_cities"
/>
<layer retrievable="1"
       writable="1"
       ns_prefix="Geomoose"
       srid="4326"
       ns_uri="http://localhost/cgi-bin/tinyows.exe"
       name="census_roads"
       title="census_roads"
       table="census_roads"
/>
<layer retrievable="1"
       writable="1"
       ns_prefix="Geomoose"
       srid="4326"
       ns_uri="http://localhost/cgi-bin/tinyows.exe"
       name="census_landmarks"
       title="census_landmarks"
       table="census_landmarks"
/></tinyows>
To display the vectors, create a Mapserver map file:
MAP
    INCLUDE '../../geomoose_globals.map'
    DEBUG 5
    WEB
        METADATA
            'ows_title' 'GeoMoose Example Census data'
            INCLUDE '../../common_metadata.map'
            'wfs_getfeature_formatlist' 'gml,geojson'
        END
    END

    LEGEND
      STATUS ON
      KEYSIZE 18 12
      # LABEL object
#      LABEL
#        TYPE BITMAP
#        SIZE MEDIUM
#        COLOR 0 0 89
#      END
    END

    LAYER
        NAME census_cities
        STATUS ON
        DUMP TRUE

        METADATA
            'ows_title' 'Cities'
            'ows_include_items' 'all'
            'gml_include_items' 'all'
        END

        CONNECTIONTYPE POSTGIS
        CONNECTION "host=localhost dbname=gis2 user=postgres password=postgres"
        DATA "wkb_geometry from census_cities"
        TYPE POLYGON

        PROJECTION
            'init=epsg:4269'
        END

        LABELCACHE ON
#           LABELMAXSCALE 20000
        CLASS
            NAME 'Cities'
            STYLE
                WIDTH 3
                COLOR 180 180 254
                OUTLINECOLOR 0 0 0
                OPACITY 50
            END

            LABEL
                TEXT "[name]"
                TYPE TRUETYPE
                FONT vera_sans
                SIZE 20
                ANTIALIAS TRUE
                COLOR 0 0 0
                OUTLINECOLOR 254 254 200
                BUFFER 4
                MINFEATURESIZE auto
                PARTIALS FALSE
                POSITION cc
            END
        END
        TEMPLATE 'dummy'
    END
END ## end Map
Edit the GeoMoose mapbook.xml to include:
<map-source name="tinyows-wfs-polygons" type="wfs" >

    <url>http://localhost/cgi-bin/tinyows.exe</url>
    <param name="typename" value="Geomoose:census_cities" />
    <config name="geometry-name" value="wkb_geometry" />
    <config name="namespace-uri" value="http://localhost/cgi-bin/tinyows.exe" />
    <config name="srs" value="EPSG:4269" />
    <config name="id-property" value="ogc_fid" />

    <!-- make sure there is no tolerance on polygon layers -->
<!--
    <config name="pixel-tolerance" value="0" />
-->
    <properties>
        <property name="geoid"    label="GeoID" />
        <property name="name"     label="Name" />
    </properties>

    <!-- the layer name does not need to match the typename but
         it is a good idea.
    -->
    <layer name="census_cities">
        <style><![CDATA[
        {
            "line-color" : "#998ec3",
            "line-width" : 4,
            "fill-color" : "#998ec3",
            "fill-opacity" : 0.1,
            "text-field": "{name}",
            "text-color": "#000000"
        }
        ]]></style>

        <template name="identify"><![CDATA[
            <div>
                <div class="item">
                    <label>{{ properties.name }}</label>
                </div>
                <div class="item">
                    ID: {{properties.geoid}}
                </div>
            </div>
        ]]></template>
    </layer>
</map-source>

<map-source name="tinyows-wms"          type="mapserver" >
    <file>./demo/census/census.map</file>
    <layer name="census_cities"    query-as="tinyows-wfs-polygons/census_cities" >
        <template name="identify"             auto="true"/>
    </layer>>
    <param name="FORMAT" value="image/png"/>
    <param name="TRANSPARENT" value="TRUE"/>
</map-source>
<group title="Feature Editing" expand="true">
    <group title="WMS + WFS (MapServer + TinyOWS)"    expand="true">
        <layer
            title="Census cities"
            src="tinyows-wms/census_cities"
            draw-edit="true"
            draw-modify="true"
            draw-polygon="true"
            draw-remove="true"
        />
    </group>
</group>
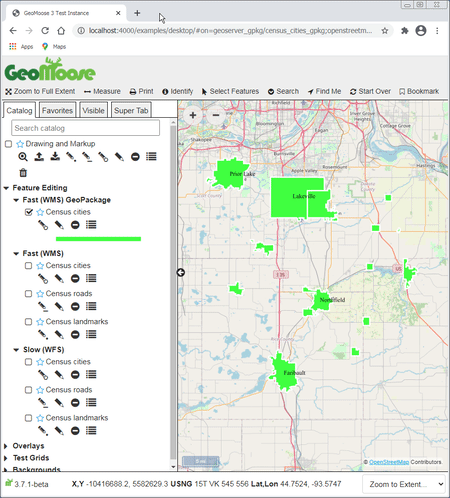
Using Vector Editing
Only some layers in the Catalog will be enabled for editing. If a layer is enabled for editing, you will see a pencil icon next to the layer name.